What is being graphed?
Consider a sequence of complex numbers
a + bi generated by the following rule:
In words: a sequence starting at Z0
= 0, and for which we define the next term Zn+1 by
squaring its previous term Zn , and adding a constant
c.
We call this sequence the orbit around the point c.
What is being graphed is the orbit around
the point c plotted on the complex plane.
c is whichever coordinate your mouse is hovering
over.
For example
If we let c = 1, then the terms of our sequence would be:
Z0 = 0 Z1 = 02 +
1 = 1
Z2 = 12 +
              1 = 2
Z3 = 22 +
              1 = 5
Z4 = 52 + 1 =
              26
...
And so on to infinity. (We call this a diverging sequence because it gets larger and larger without end. More on this below.)
Or if we let c = i, then we have:
Z0 = 0 Z1 = i
Z2 = -1 + i
Z3 = -i
Z4 = -1 + i
Z5 = -iZ6 = -1 + i
...
And so on, oscillating between the two values
-i and
-1 + i. (We consider this sequence
bounded because it does not diverge.)
These terms Z1, Z2, ...Zm form the vertices of the shape
that is plotted when your mouse is hovering over a given
c.
In all cases, Z1 = c.
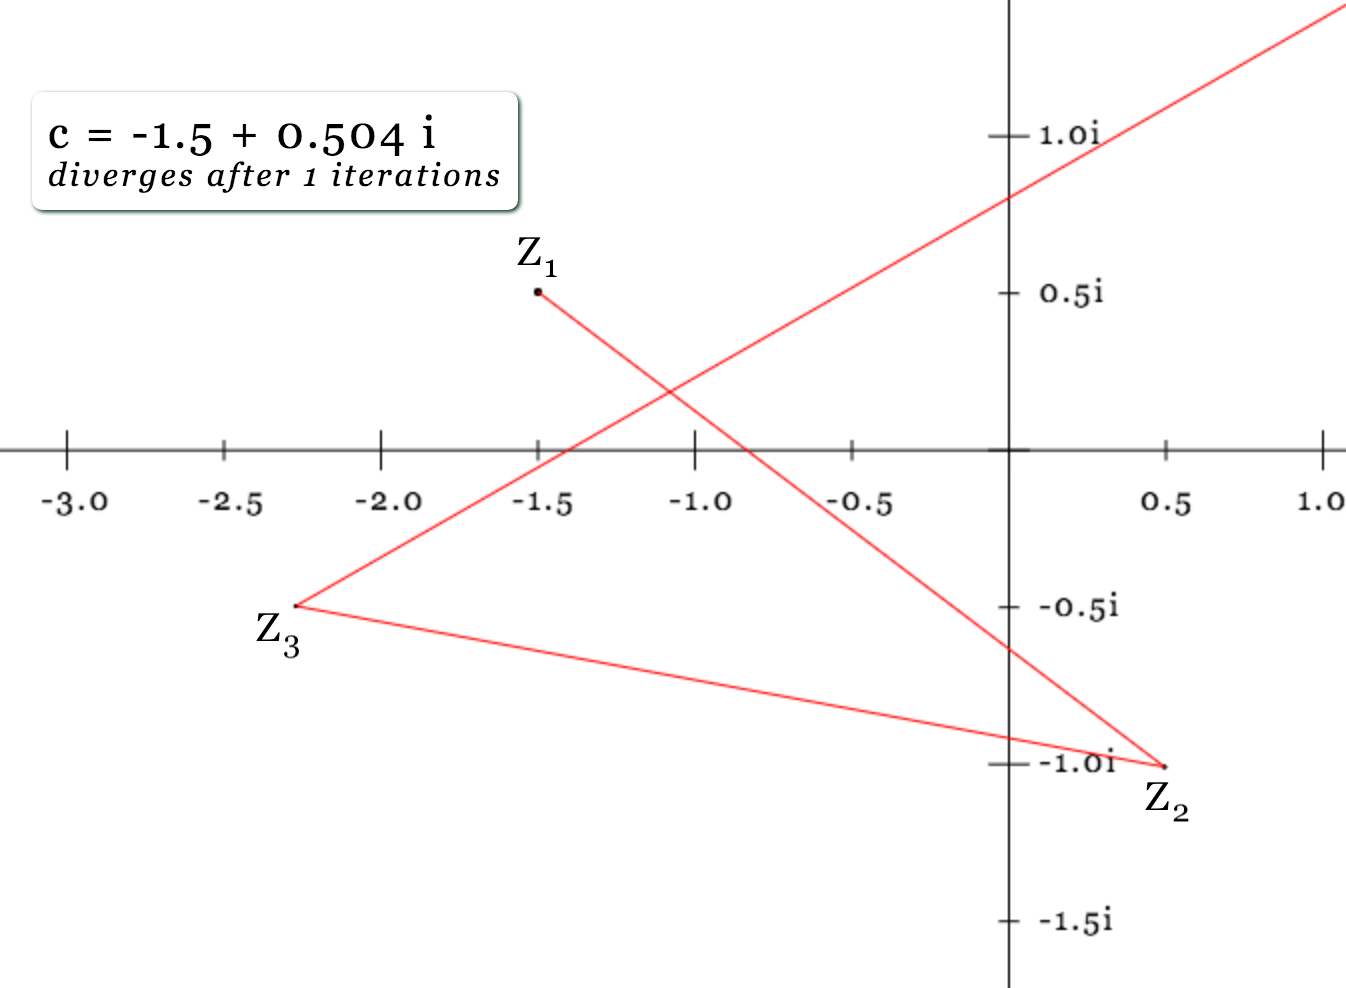
c = -1.5 + 0.5iWhy does the graph change colors?
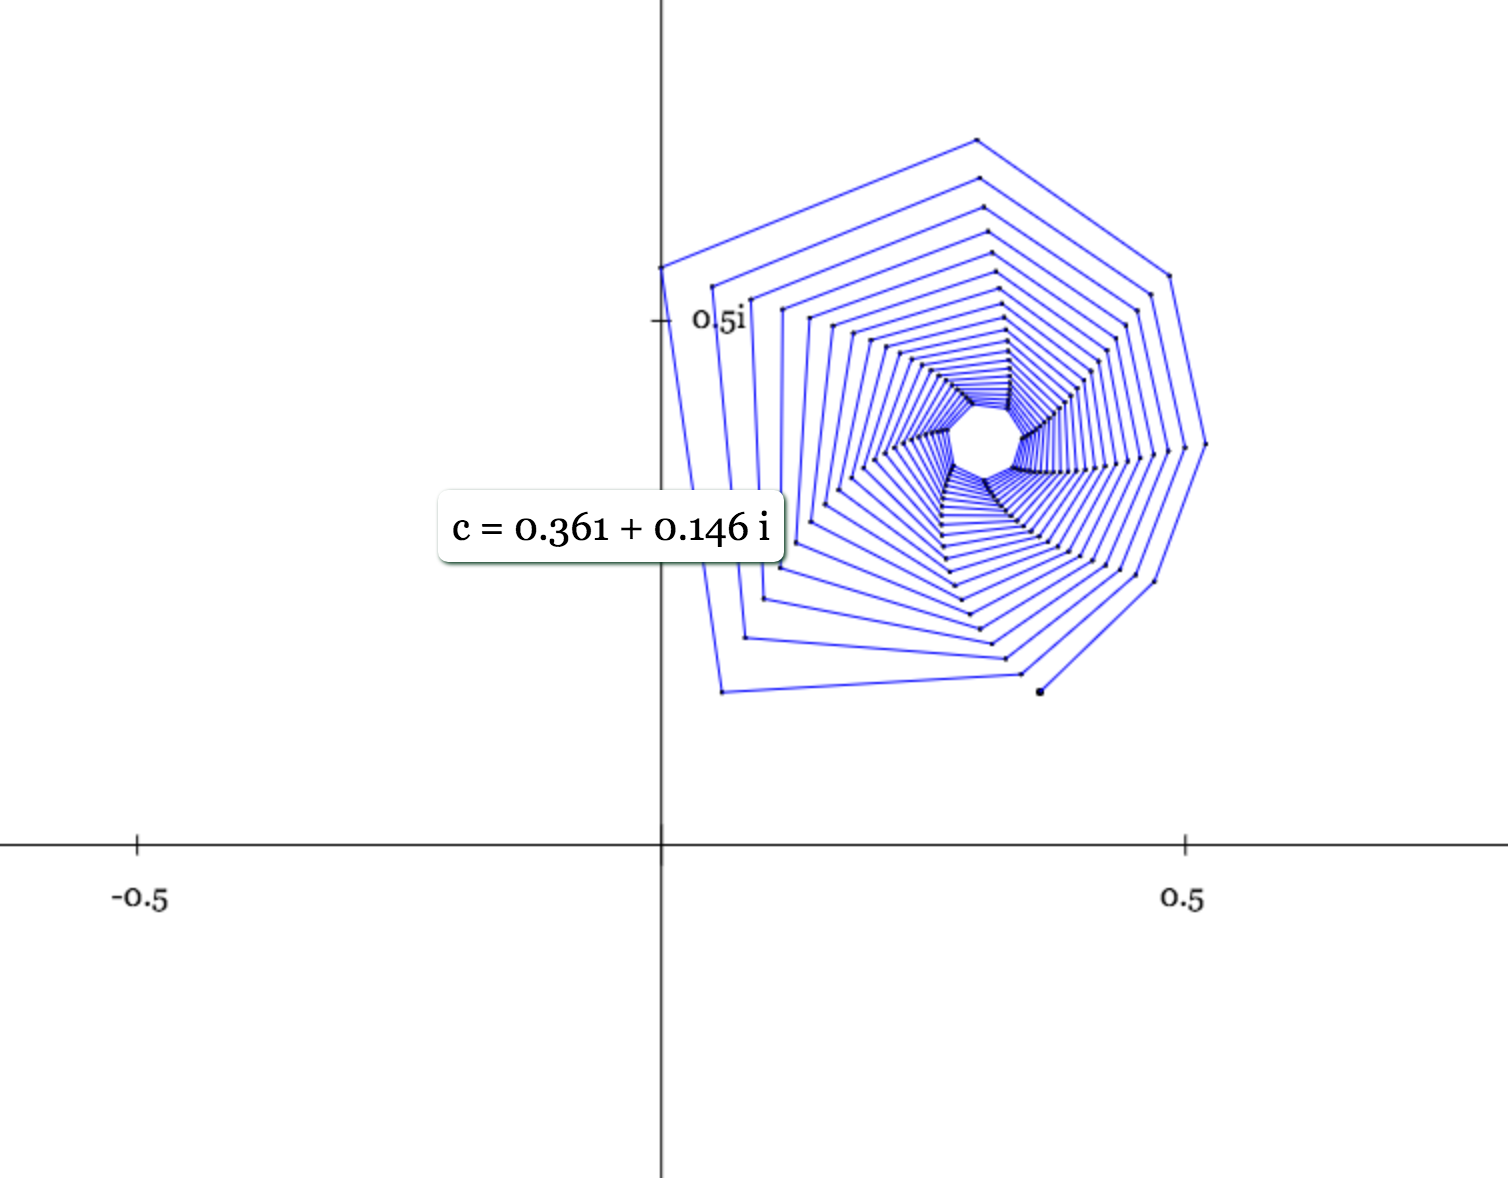
If the sequence remains bounded, it is colored blue. Otherwise, it is colored red.
A sequence is considered bounded when the
terms never leave the area near the origin, either becauase they
converge to a single value, or because they oscillate between two
or more vaulues (example above where c = i or in
image below where c = -0.361 + 0.146i)
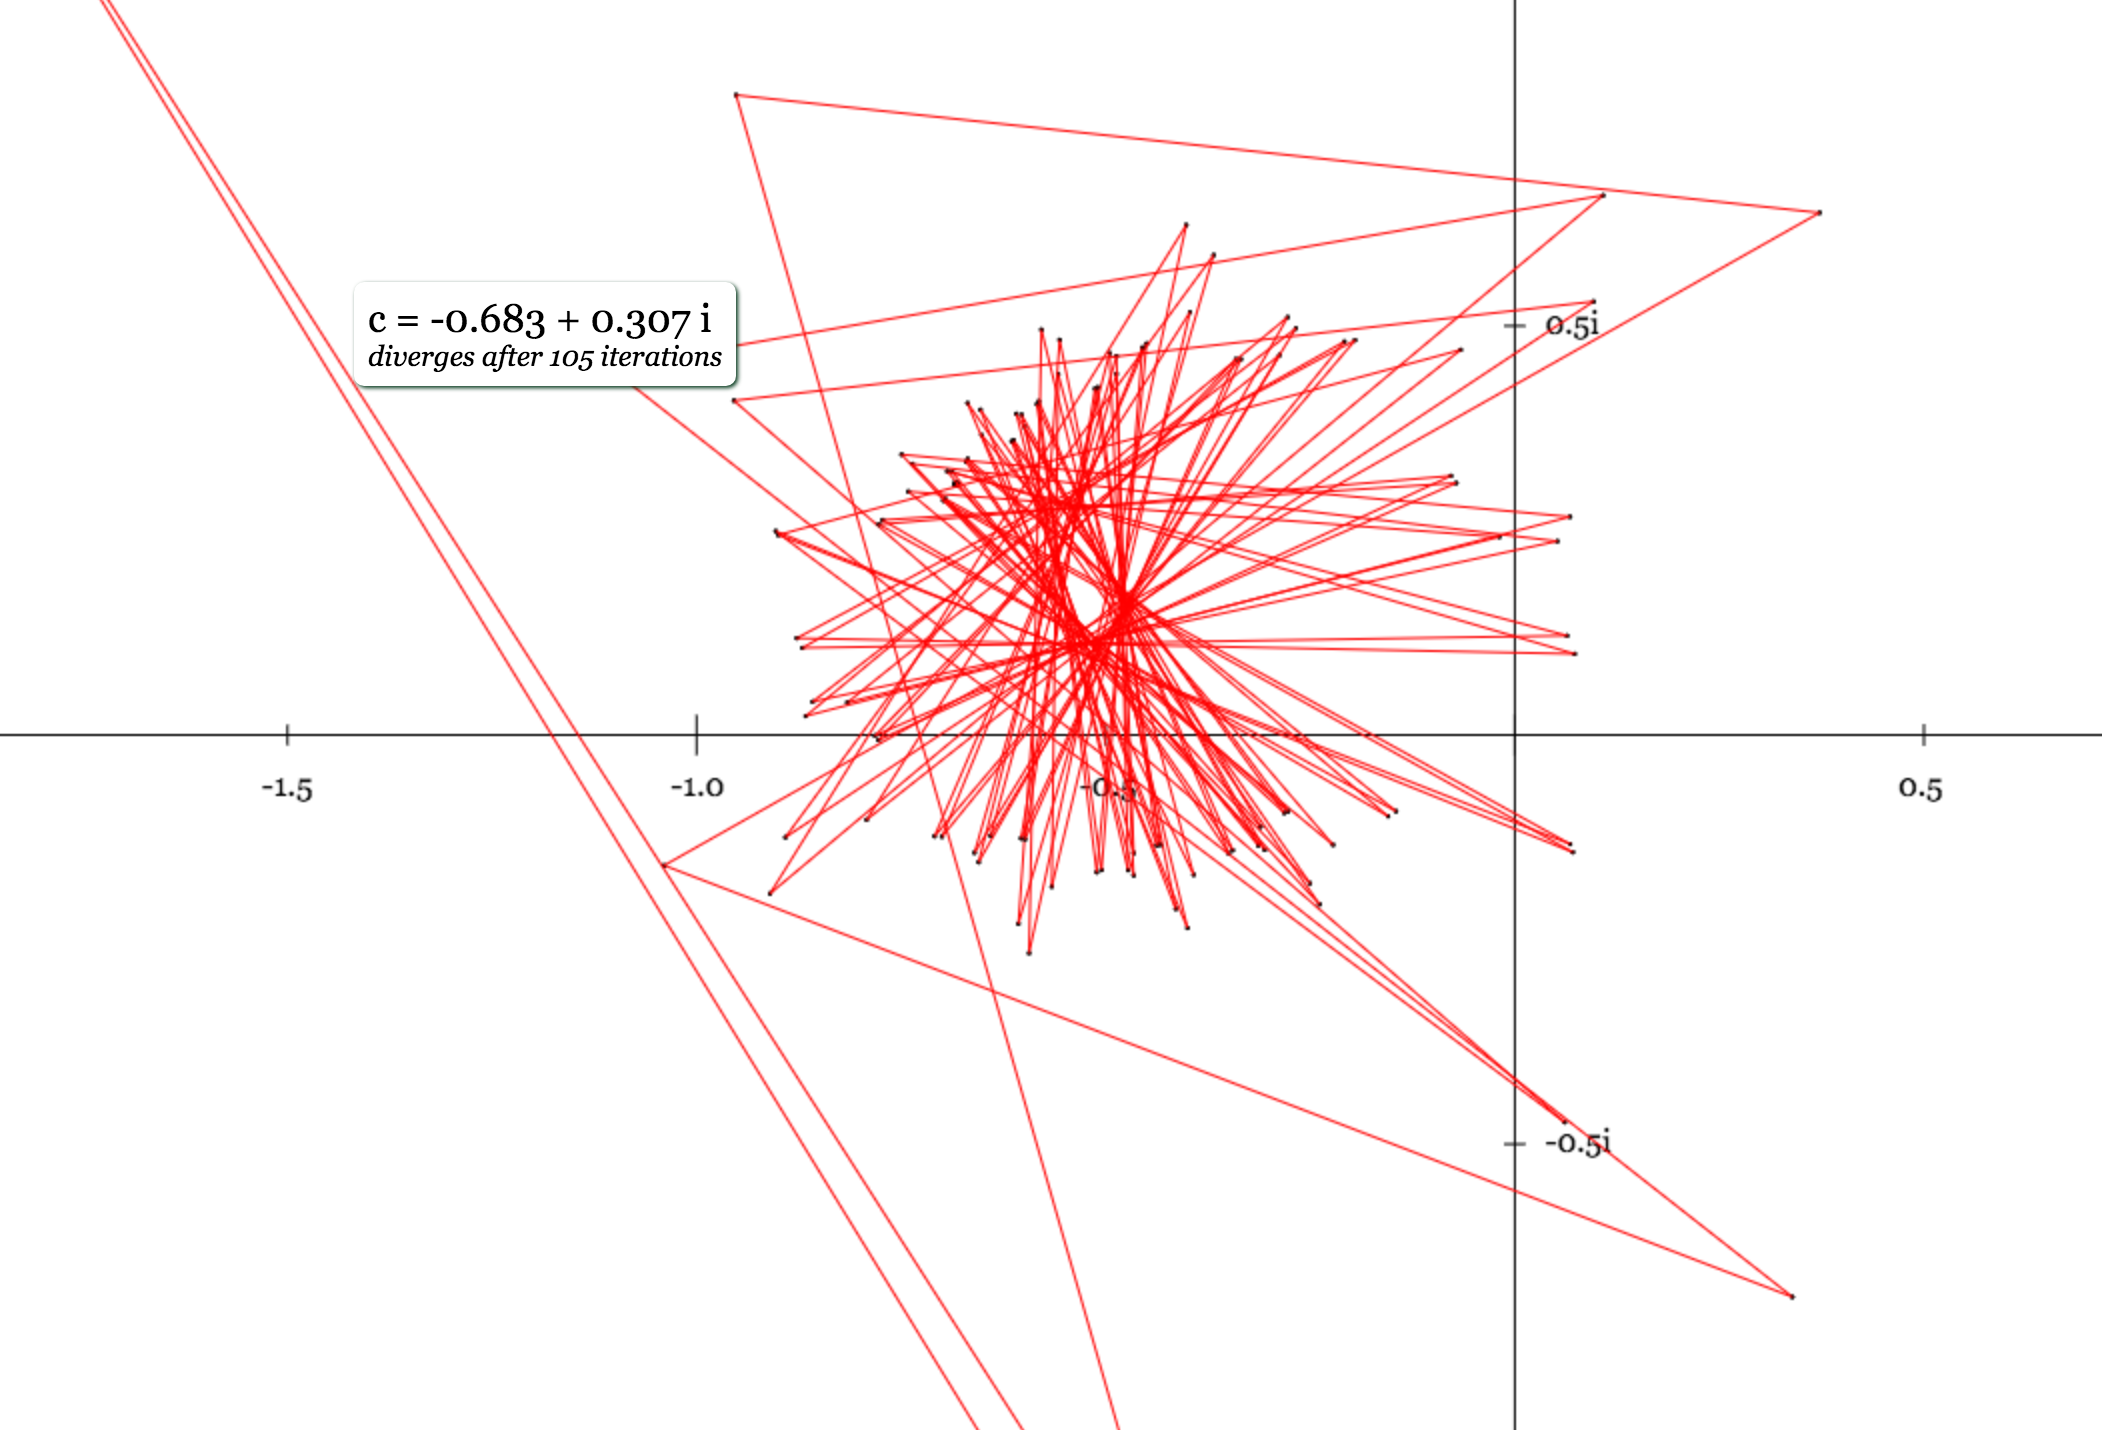
Otherwise, if the terms "explode" to higher and higher values we
consider it
divergent (example above where
c = 1 or below where
c = -0.683 + 0.307i).
It is sometimes easy to tell when the graph diverges. Once any
term in the sequence passes the "point of no return" (which is
when the pythagorean distance is more than 2 units
away from the origin), it can be demonstrated mathematically that
the sequence can never start getting smaller again.
However, in other cases, it is less clear whether a c-value point will remain bounded or will eventually diverge. For some c-values, the sequence will "bounce around" the origin hundreds of times before eventually passing the point of no return. In other cases, it can bounce around orders of magnitude many more times before leaving the bounded zone. It is not always computationally possible to calculate so many iterations of the seqeunce.
Hence, this plot logic uses a threshold value of 150. If the sequence has not diverged after 150 iterations, we assume it is bounded.
Where is the sequence bounded?
The natural question one might ask is for which region on the graph is the sequence bounded, and which not? If you have never seen this before, think for a moment and make a prediction.
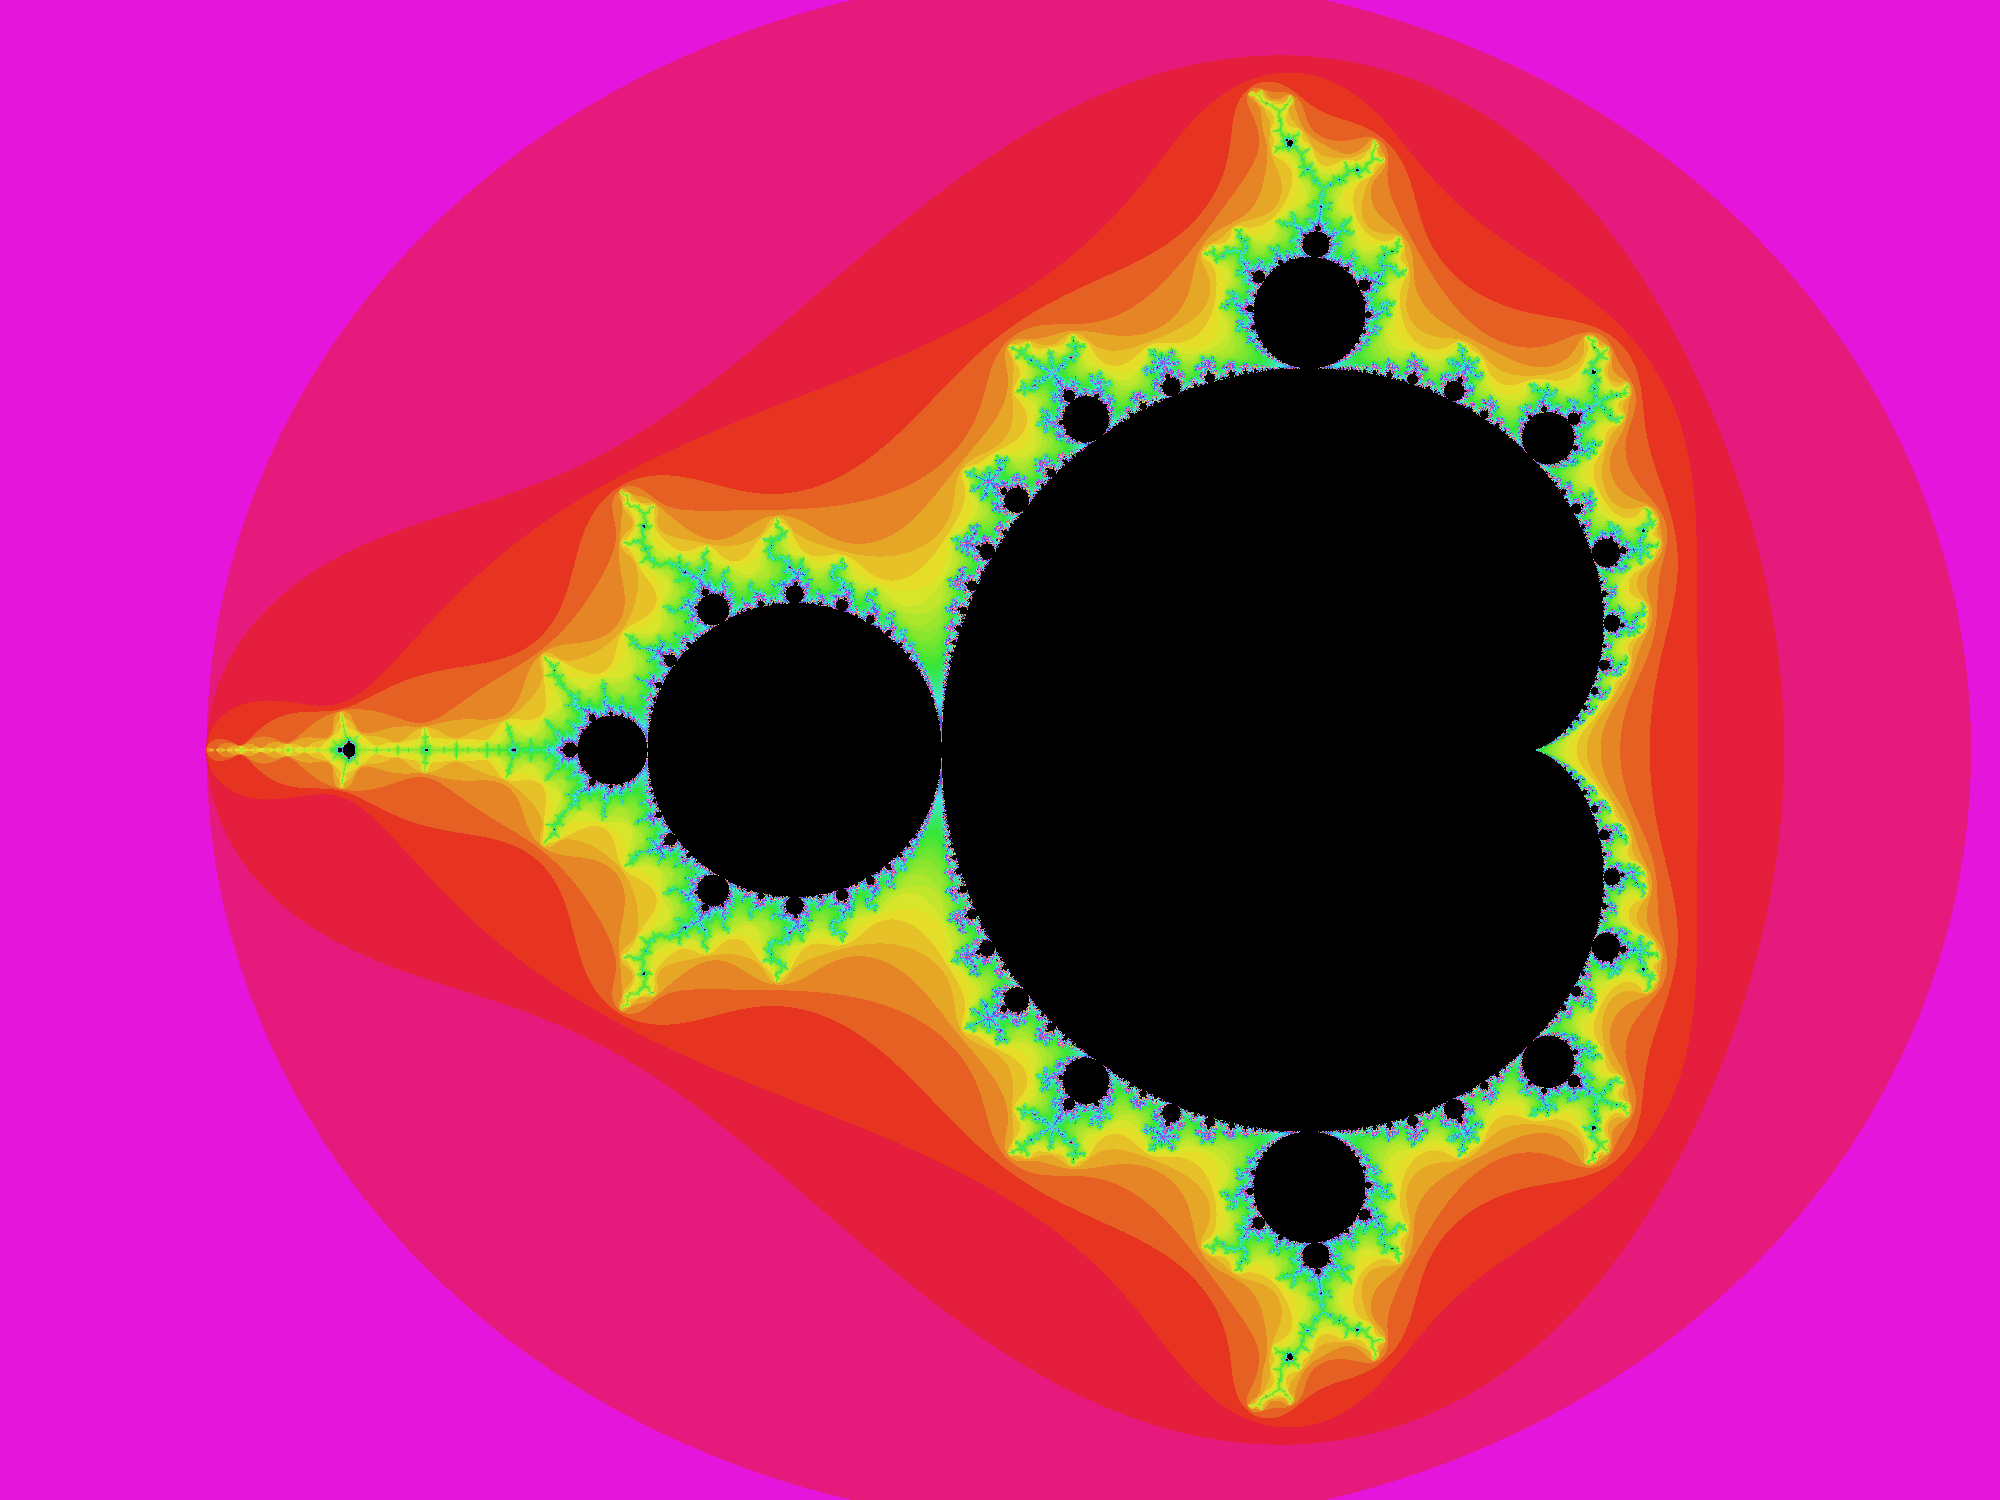
Mathematician Benoit Mandelbrot had the same question, and set his computer at work, and came back to surprising results. The answer was more fascinating than he expected. Today we call the set of points c for which the sequence remainded bounded the Mandelbrot set.
The Mandelbrot set is illustrated below, with the black regions representing points in the set, and colored regions representing points outside the set. (The specific coloring below is arbitrary, but correlates to how many iterations of the sequence before the point is known to diverge.)
Whereas we might have expected a simply shaped region with a sharp, well-defined border, what was instead discovered was a beautifully complex shape with an infinitely detailed border; however much you "zoom in" with your decimal precision doing the calculations, the shape will never become smooth, it remains complex at any scale. This type of shape is called a fractal.
For example: c = i remains bounded, but
c = 1.00001i will diverge after a dozen or so
iterations.